Epigenome Toolset
The Genboree Epigenome Toolset provides a web-based environment for scientists at all levels of bioinformatics experience to conduct epigenomic analyses.
Please access the step-by-step tutorials for performing analyses similar to those described in our paper in Nature Comm. (Feb, 2015).
Epigenome Tutorial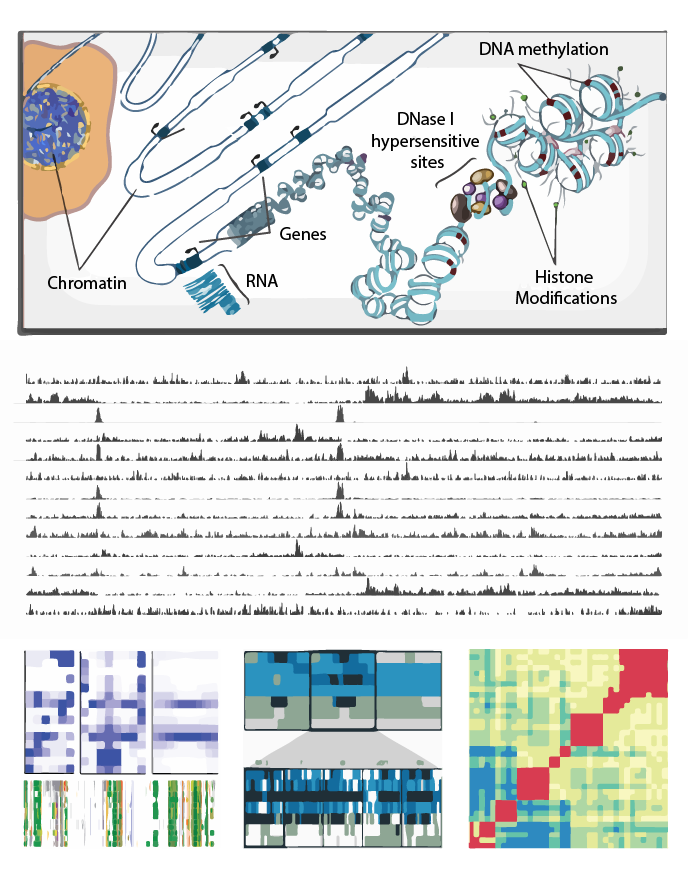
Overview of Tools
Epigenomic Data Slice
The Epigenomic Data Slice tool provides read information for a given sample and set of regions. Users can use the tab-delimited output file, which contains average signals of an epigenomic mark over a given set of regions of interest, for further off-line analysis. For example, users can use this information for generating a read density plot at the transcription start sites.
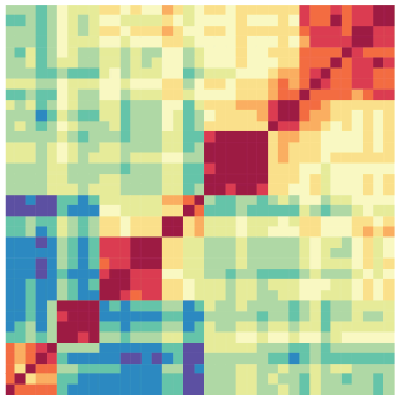
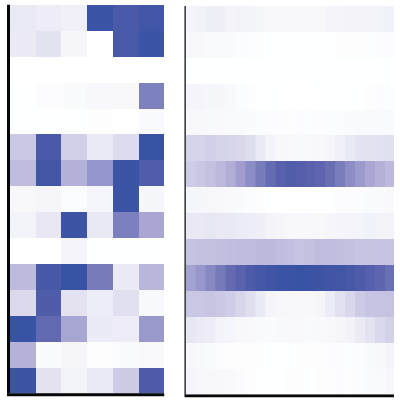
Heatmap
The Heatmap tool computes the similarity between datasets based on epigenomic signal. Several distance metric options are available to calculate the similarity between datasets and results are presented visually as a heatmap.
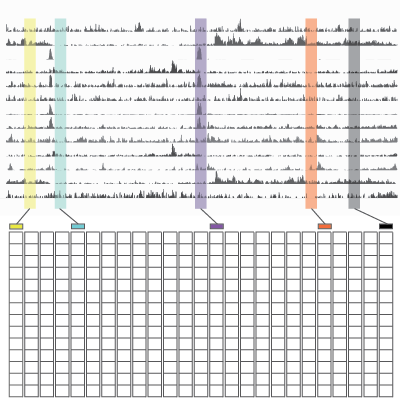
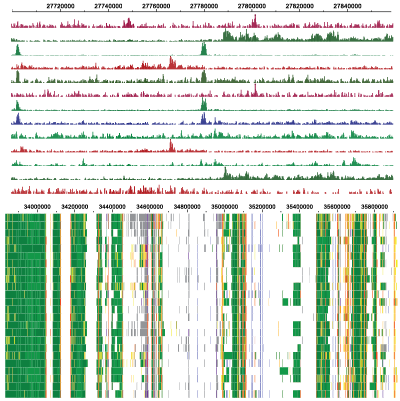
Spark
Spark is a visualization tool that employs clustering (k-means) of epigenomic data, such as chromatin marks from Chip-Seq experiments. The visualization allows one to examine epigenomic patterns across multiple datasets in a genome-wide perspective, while also enabling one to drill down to specific individual loci.
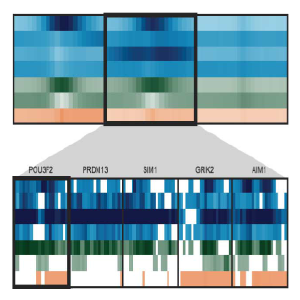
ChromHMM
ChromHMM is a tool for learning and characterizing chromatin states (e.g., active transcription start sites (TSS), active enhancers, etc.). ChromHMM LearnModel uses binarized data files and learns a chromatin state model. It generates both the learned chromatin-state model parameters and the chromatin-state assignments for each genomic position.
Enrichment Tools
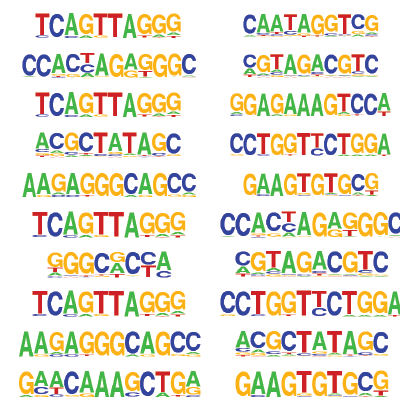
HOMER (Hypergeometric Optimization of Motif Enrichment) is a motif discovery algorithm designed to find enriched motifs for a set of genomic regions.
GREAT (Genomic Regions Enrichment of Annotations Tool) is another enrichment tool that assigns biological meaning to a set of non-coding genomic regions by performing gene ontological (GO) enrichment analysis of nearby genes.
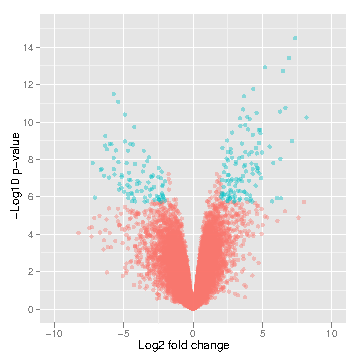
LIMMA
LIMMA (Linear Model for Microarray Analysis) is a tool that performs signal comparison of next-gen sequencing data and outputs the differences in signal intensity between samples of interest. This allows one to determine differences between samples (i.e., control muscle versus treated muscle). Differences may include differential methylation (if MeDIP input) or gene expression level (if RNA-seq input).
Select Publications
-
-
The International Human Epigenome Consortium: A Blueprint for Scientific Collaboration and Discovery
Cell. doi: 10.1016/j.cell.2016.11.007 (2016)
PMID: 27863232
-
Epigenomic Deconvolution of Breast Tumors Reveals Metabolic Coupling between Constituent Cell Types
Cell Rep. doi: 10.1016/j.celrep.2016.10.057 (2016)
PMID: 27851969
-
Nat. Commun. 6:6370 doi: 10.1038/ncomms7370 (2015)
PMID: 25691256
-
Integrative analysis of 111 reference human epigenomes
Nature doi: 10.1038/nature14248 (2015)
PMID: 25693563
-
BMC Bioinformatics. 2014;15 Suppl 7:S2. doi: 10.1186/1471-2105-15-S7-S2. Epub 2014 May 28.
PMID: 25080362
-
Comparison and quantitative verification of mapping algorithms for whole-genome bisulfite sequencing
Nucleic Acids Res. 2014 Apr;42(6):e43. doi: 10.1093/nar/gkt1325. Epub 2014 Jan 3.
PMID: 24391148
-
Recommendations for the design and analysis of epigenome-wide association studies
Nat Methods. 2013 Oct;10(10):949-55. doi: 10.1038/nmeth.2632. Review.
PMID: 24076989
-
PLoS Genet. 2013;9(2):e1003333. doi: 10.1371/journal.pgen.1003333. Epub 2013 Feb 28. No abstract available.
PMID: 23468659
-
Spark: a navigational paradigm for genomic data exploration
Genome Res. 2012 Nov;22(11):2262-9. doi: 10.1101/gr.140665.112. Epub 2012 Sep 7.
PMID: 22960372
-
Genome Biol. 2012 Jun 15;13(6):R43. doi: 10.1186/gb-2012-13-6-r43.
PMID: 22703893
-
PLoS Genet. 2012;8(5):e1002692. doi: 10.1371/journal.pgen.1002692. Epub 2012 May 17.
PMID: 22615578
-
Emerging patterns of epigenomic variation
Trends in Genetics, 2011 Jun;27(6):242-50
PMID: 21507501
-
Putting epigenome comparison into practice
Nat Biotechnol., 2010 Oct;28(10):1053-6
PMID: 20944597
-
The NIH Roadmap Epigenomics Mapping Consortium
Nat Biotechnol., 2010 Oct;28(10):1045-8
PMID: 20944595
-
Nat Biotechnol., 2010 Oct;28(10):1097-105
PMID: 20852635